John Errington's Experiments with an Arduino
Logging power from a solar panel installation

My domestic solar panel installation (nominally 4kW) uses a Landis & Gyr E110 meter like this to record the output from the panels. The meter provides an optical pulse output that gives 1 pulse of visible light for every watt of power generated.
I wanted to keep a record on file of the daily power generation and max power generated; and also to display the current values on a webpage.
A link to the sketch is provided below.
The ESP32 devkit was chosen for this application because it can:
- provide serial output during testing
- maintain a wifi connection* to maintain ntp time, and
- pass webpage updates via server sent events
- store and retrieve data to file via SPIFFS
- provide an FTP service to let me download the monthly data files.
The wifi connection is established and maintained using wifi events as described in this article
https://techtutorialsx.com/2019/08/11/esp32-arduino-getting-started-with-wifi-events/
The circuit of the solar power generation logger

The electrical circuit is very simple. The ESP32 is powered by a USB adaptor, and supplies the external circuit.
Two LEDs are provided -
Blue to show that the wifi connection is live, and
An Amber LED that just flashes in synch with the pulses from the electricity meter.
When the light is OFF the diode is not conducting, so the transistor is turned off, and pin 13 (configured as INPUT_PULLUP) is HIGH.
When the light is ON the photodiode allows current to flow from the 3V3 supply to the base of the transistor (almost any npn transistor will do).
The transistor turns on, pulling pin 13 LOW.
The 47k resistor protects the transistor when the plug (PHONEP) is removed for installation.
( Schematic produced with TinyCAD )
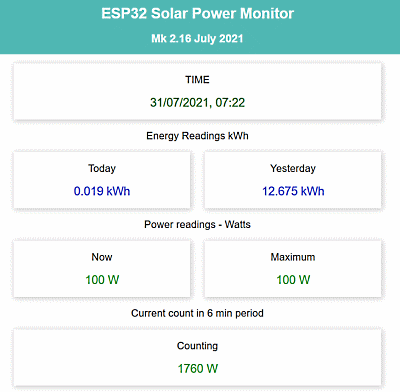
The web page display

Pulses are counted over a 6 minute period (int pCount).
If the system receives 176 pulses in 6 minutes then in 1 hour it would have counted 1760 pulses corresponding to 1760 watts of power. pCount is multiplied by ten to give the current watts (cWatts) (Counting) as shown here.
At the end of a 6 min period it's passed to pWatts (Now) and the maximum recorded value mWatts (Maximum) in a 6 min period is updated.
pCount is also added to the "Today" value dTotalKwh which keeps a record of total kWh so far during that day.
At the end of the day dTotalkWh is passed to yTotalkWh "Yesterday" and dTotalkWh is reset to zero.
This display allows us to see the Solar Panel installation is working correctly.
The program
Setup
Following a reset the system: configures the I/O; establishes a wifi conection with my router; starts the SPIFFS and FTP; gets the local time to open files for month and day data; starts an asynchronous web server to show data on a web page; and finally configures pin 13 to generate an interrupt on a RISING edge ( ie when the light pulse goes OFF).
Loop
The main program runs as a simple State Machine (SM), with ten states. Each state concludes by setting to the following state - so its just a sequence. A timer initiates the SM every 100msec so a complete loop takes 1 second.
Every loop - reflect input pulse state to Amber LED, and handle FTP();
State 0: update the time
State 1: handle the day and month data
- checkPeriod(); if 6 minutes has elapsed, update the web display and day data file
- newDay(); if its a new day save day data to monthly data file
- newMonth(); if its a new month create a new file named /YYYY_MM.csv
State 2: ping the web server
State 3: update the web page display of the date and time via a server sent event
State 4: to State 8: all follow this same pattern
- if 6 minutes has elapsed (equal to 6 times around the loop)
- update ONE element on the web page - eg current watts
- proceed to next state
State 9: just included to make ten states in all; return to State zero.
Why use a state machine?
The Asynch Web Server crashed if events were sent too frequently. In this loop each is sent with a delay of 100msec which allows the buffer to clear before the next is sent. Actually, on test and with a good wifi connection it can cope with a much shorter interval.
The state machine allowed this to be handled in a very clear way, and also gave better service for FTP transfer.
The finished unit
 The unit shown here fits into a small plastic box, with holes for 2 * 3mm LEDs, the 3.5mm jack socket that connects the sensor, and a cut-out for the USB connector.
Power is normally provided from a "wall wart" USB adaptor, but because data is stored on files the unit can be removed for testing, and connected to a laptop to use a serial monitor without significant loss of data.
Also the system is resilient to temporary power loss.
THE SKETCH
