
John Errington's Experiments with an Arduino
Measuring characteristics of an active device
Overview
 This experiment aims to use an Arduino to measure the V-I characteristic of a device - a diode, LED, transistor etc.
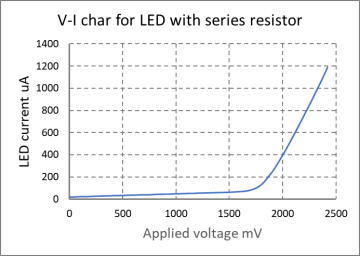
It uses a PWM output as an ADC to provide a gradually increasing voltage to the device, starting at zero; and measures the resulting current to enable us to plot a V-I characteristic, as shown here.
I used I/O pin 9 which is controlled by Timer1 becasue this doesnt cause isses with other timing functions (eg delay(), millis())
The experiment was developed using an Arduino Uno, but could easily be adapted to run on any of the Arduino range as it requires only one PWM output and a few ADC inputs.
Convert PWM to a DC voltage
To convert the rectangular wave to a stable DC voltage we can use a simple RC filter (for more information see my page on Pulse Width Modulation). When the PWM frequency is only 490Hz thats not easy. We can resolve this difficulty by changing the frequency divider for the appropriate timer.
- Timer0 - An 8 bit timer used by Arduino functions delay(), millis() and micros(). Pins 5 & 6
- Timer1 - A 16 bit timer used by the Servo() library. Pins 9 & 10
- Timer2 - An 8 bit timer used by the Tone() library. Pins 3 & 11
We generally avoid changing Timer0 because of the problems it raises with the timing functions. I've chosen to use pin 9 (Timer1) to avoid this.
The base frequency for Timer1 is 31250 Hz, and divisors of 1, 8, 64, 256, and 1024 are available;
these give PWM frequencies of 31,250Hz; 3906Hz; 488Hz; 122Hz; 30.5 Hz;
Either 31kHz or 3.9kHz work well with the filter values shown (47k, 47nF).
The "setPwmFrequency(int pin, int divisor)" function in the sketch sets the prescaler for the chosen timer up automatically as required.
Finally - the electronic circuit: three main sections: filter, buffer and difference amplifier
The tester uses just two "rail-rail" op amps and 7 resistors and two capacitors (one for power supply decoupling). A1 && A2 used both sections of a MCP6002 dual op amp. For extremely accurate results the resistors (especially Rs) need to be accurate (eg 0.1%), and ideally R3:R5 and R4:R6 should be matched.
 RC Filter
As you can see the PWM signal is fed to a simple RC filter, R1 C1. The cut-off frequency is chosen to be MUCH less than the PWM signal, but provide a short time constant when compared to the time between voltage changes (typically 0.5sec)
Buffer
Negative feedback around A1 forces the voltage at pin 2 to be the same as pin 3; so V1 is the same as V0. However the op amp can provide a current of up to 20mA to the device under test. (DUT).
R2 measures the current through the DUT as V3 = i(DUT) * Rs
Difference amplifier
A2, with R3, R4, R5, R6 measures the voltage across the 100 ohm resistor R2. By choosing R3=R5, and R4 = R6 the output voltage to ADC2 is V2 = V3 * R6/R5.
How it all works
Suppose the current through the device is 2mA. The same current flows through the shunt resistor Rs, and 2mA * 10 ohm = 20mV
A2 amplifies this to give 0.2V at the output, representing a current through the DUT of 2mA.
ADC1 measures the VOLTAGE across the DUT; ADC2 measures the voltage across the shunt resistor to give CURRENT in mA through the DUT.
For lower current ratings we could change the value of R2 to say 100 ohm, when 2mA would result in 200mV to ADC2.
The sketch -> GET IT HERE
Basically the sketch just cycles the PWM from a start value (nMin) up to an end value (nMax) through a series of steps. At each step all the ADC inputs are read. Each ADC value is read 16 times with a 7ms delay between. This reduces noise in the signal. So reading 1 ADC takes about 112msec and reading all 3 (or 4) 350 / 460msec.
(There is an option to read a voltage reference for calibration / comparison)
All readings are converted to mV / mA and sent to the serial output in .csv format ready to import to EXCEL.
Results
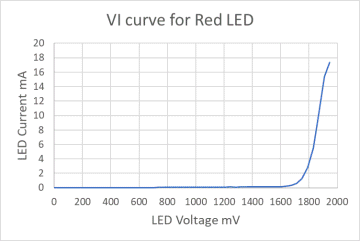 The tester shows the knee voltage for this red LED at about 1700mV, and the slope resistance of about 12 ohms.
References
https://cdn.sparkfun.com/assets/resources/4/4/PWM_output_Arduino.pdf
https://playground.arduino.cc/Code/PwmFrequency/
http://r6500.blogspot.com/2014/12/fast-pwm-on-arduino-leonardo.html