John Errington's Data Conversion Website
Quantization Error and Signal-to-Noise Ratio (SNR)
Whenever we convert between digital and analog domains we introduce small errors that degrade the accuracy of the data. One way of analysing this is to look at what happens when we try to measure a sine wave.

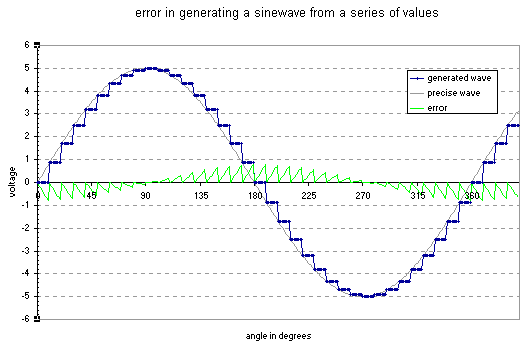
This diagram shows a true sine wave in gray, and in blue the wave you get if you try to generate a sine wave using 36 samples. You can think of this as a true sine wave plus an error signal called quantization error. The green line shows the size of this error signal.
Another way of looking at this is to suppose that the gray wave is a signal you are measuring with an ADC. The stepped blue line then represents the data values of your readings. The question we need to address is how accurately the blue and gray lines must match. This is dealt with in the next section.

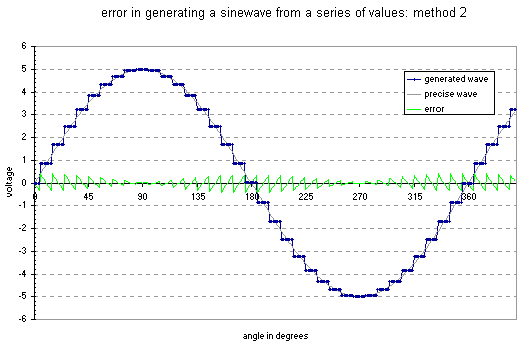
Here you see a slightly different method for generating values. The value generated is that for the mid-point between the current and next time points. Because of this the error signal is simpler. However in both cases you can see that the total error over one cycle is twice the peak to peak amplitude of the wave (or four times the peak value). The errors form a staircase to the top, down to the bottom and back to the middle. The total error is 4 * Vpk so for n samples per wave the average peak error size Vpke is 4 * Vpk / n
Here the analysis begins, to find the frequency and size of components of the whole signal.
The error signal is nearly a triangle wave; and the rms voltage for a triangle wave is Vrmse = Vpke / sqrt 3 whence Vrmse = 4 * Vpk / n sqrt 3
but the rms value for the sine wave is Vpk / sqrt 2 i.e. Vrms = Vpk / sqrt 2
so the error signal expressed as a fraction of the sine wave signal is
e = Vrmse / Vrms = 4 * sqrt 2 / n * sqrt 3 = 3.266 / n
Now, fourier analysis shows a sawtooth wave of period T = 2 / w and amplitude A ( = 3.266 / n ) can be made up from a series of sine waves
ewave = ( 2A / ) * ( sin wt - 0.5 sin 2wt + 0.33 sin 3wt - ...)
ewave = ( 2.08 / n ) * ( sin wt - 0.5 sin 2wt + 0.33 sin 3wt - ...) and we can see that the error signal amplitudes (ignoring shape and phase) are
|ewave| = ( 2.08 / n ) * (1 at nfo +0.5 at 2nfo +0.33 at 3nfo +0.25 at 4nfo + 0.2 at 5nfo + ...)

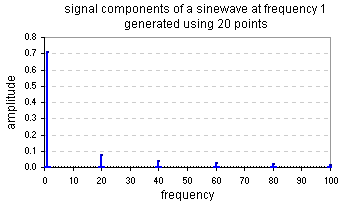
Here you can see the relative size and frequency of the components of a sine wave synthesized using 20 samples per wave. The wave as expected has a fundamental at fo and error signals at n, 2n, 3n .... times fo.
The error signals have reducing amplitudes starting at about 2/n of the fundamental.
The analysis above is followed in more detail in the next page - Signal to Noise Ratio
